A model leaderboard reads like a build number: one authoritative ranking, settled. But an eval score is a sample statistic, and the gap between first and second is usually well inside the noise. A ranking reported without an interval is a point estimate wearing the costume of a fact.
Author
Matthew Gibbons
Published
19 June 2026
A new model took the top of the index this week, and the screenshot went round before lunch. One open-weights release had edged ahead of the rest on a composite benchmark, by a fraction of a point, and that was enough: the ranking flipped, the old leader dropped to second, and everyone updated their mental note of which model to reach for. I did it too. You glance at the column, read off the order, and move on, the way you’d read a version number or a green build.
That’s the instinct I keep having to slow down, and it’s mine by default: the engineer’s reflex, reading a ranked column as a result. A leaderboard looks like a verdict, sorted and ranked with first place unambiguous, and it carries the same finality as a passing test or a tagged release — a fact about the world that’s now settled and that you can build on. The part I’d been reading straight past is that the number in that column is a measurement, and measurements come with error bars even when the leaderboard forgets to print them.
A score is a sample, not a property
What the ranking hides is what the percentage is made of. When a model scores 71.2% on a benchmark, that percentage isn’t a property of the model the way its parameter count is. It’s the result of running the model over some finite set of tasks — a few hundred questions, maybe a couple of thousand — and counting how many it got right. Swap in a different sample of tasks of the same kind and you’d get a slightly different number. The score is a draw from a distribution, and the benchmark is showing you one draw and rounding it to one decimal place.
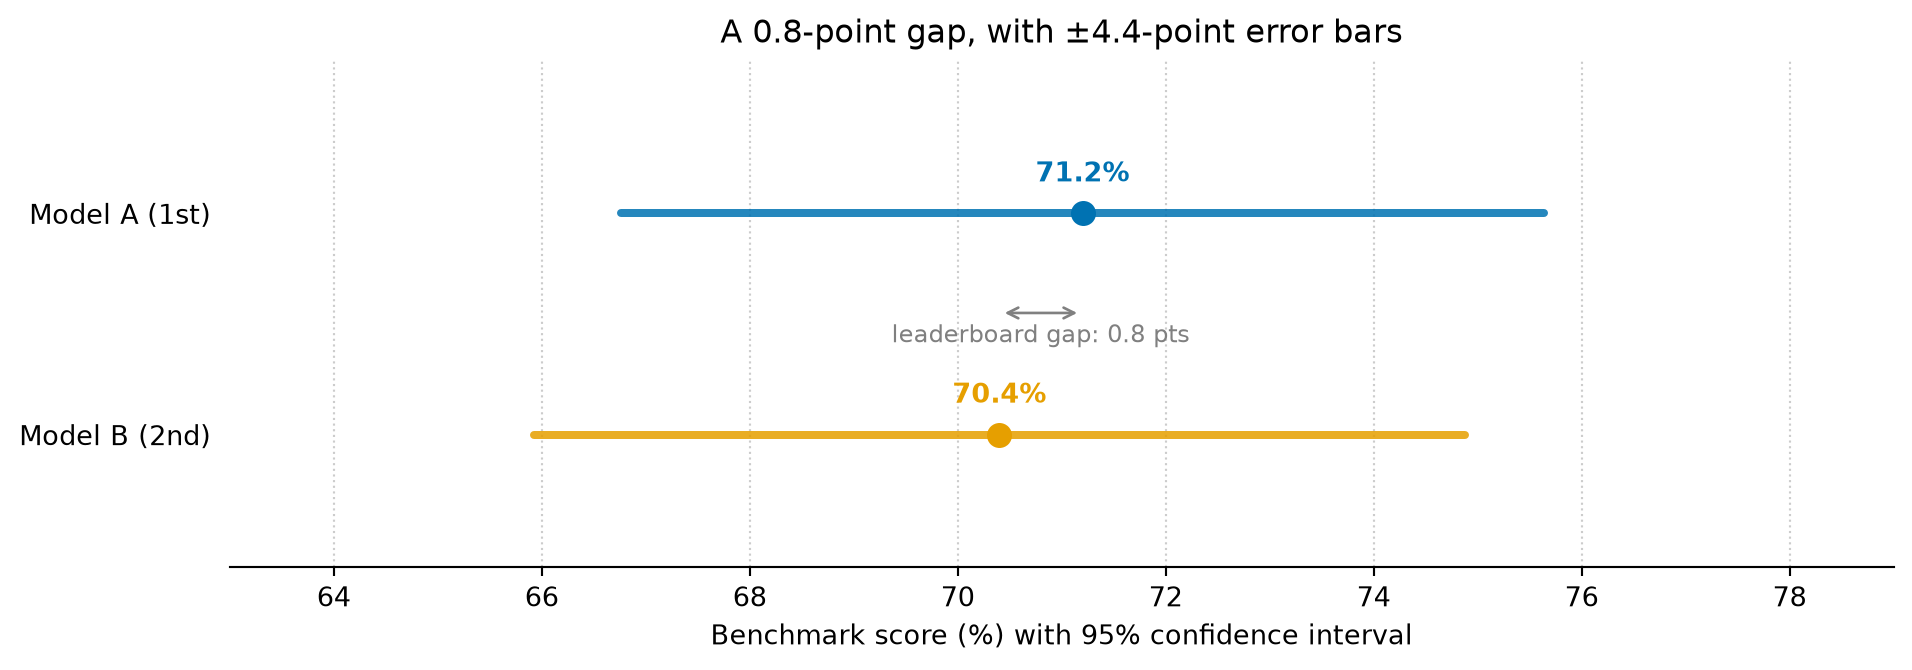
Say that out loud and the question shifts under you. It stops being “which model is best?” and becomes “by how much, and how sure are we?” — and that second question, unlike the first, has an answer you can compute. A proportion measured over n items has a standard error of roughly sqrt(p(1-p)/n), which for a benchmark of four hundred tasks works out to a 95% confidence interval of about plus or minus four and a half points. I ran that arithmetic expecting a footnote and then sat with the result for a while. The model on top with 71.2% is really saying “somewhere around 67% to 76%.” The model in second place with 70.4% is saying “somewhere around 66% to 75%.” Those two statements are almost the same statement.
Show the code behind this figure
import numpy as npimport matplotlib.pyplot as plt# Two models, near the top of a 400-task benchmark scored pass/fail per task.n =400models = [ ("Model A (1st)", 0.712, '#0072B2'), ("Model B (2nd)", 0.704, '#E69F00'),]fig, ax = plt.subplots(figsize=(10, 3.6))fig.patch.set_alpha(0)ax.patch.set_alpha(0)ys = [1, 0]for (label, p, colour), y inzip(models, ys): se = np.sqrt(p * (1- p) / n) # standard error of a proportion half =1.96* se # 95% confidence interval half-width ax.plot([(p - half) *100, (p + half) *100], [y, y], color=colour, linewidth=3, alpha=0.85, solid_capstyle='round') ax.scatter([p *100], [y], color=colour, s=70, zorder=4) ax.annotate(f'{p*100:.1f}%', xy=(p *100, y), xytext=(0, 12), textcoords='offset points', ha='center', color=colour, fontsize=10, fontweight='bold')# Mark the gap the leaderboard is ranking on.ax.annotate('', xy=(71.2, 0.55), xytext=(70.4, 0.55), arrowprops=dict(arrowstyle='<->', color='grey', lw=1))ax.annotate('leaderboard gap: 0.8 pts', xy=(70.8, 0.5), ha='center', va='top', color='grey', fontsize=9)ax.set_yticks(ys)ax.set_yticklabels([m[0] for m in models])ax.set_ylim(-0.6, 1.7)ax.set_xlim(63, 79)ax.set_xlabel('Benchmark score (%) with 95% confidence interval')ax.set_title('A 0.8-point gap, with ±4.4-point error bars')ax.spines['top'].set_visible(False)ax.spines['right'].set_visible(False)ax.spines['left'].set_visible(False)ax.tick_params(left=False)ax.xaxis.grid(True, linestyle=':', alpha=0.4, color='grey')ax.set_axisbelow(True)plt.tight_layout()plt.show()
Figure 1: The leaderboard reports a 0.8-point gap between first and second place. The 95% confidence intervals, for a benchmark of 400 tasks, are about ±4.4 points wide and overlap almost entirely. A two-proportion test on this gap returns p ≈ 0.80: there is essentially no evidence that the top model is better than the runner-up. The ranking is real; the difference it implies is not.
Run a two-proportion test on that 0.8-point gap and it returns a p-value of about 0.80. Working out what that actually licensed me to say took longer than running the test. It isn’t evidence that the models are equal, and it isn’t evidence the top one is better — it’s the data declining to speak to the ordering at all. On this benchmark the two are indistinguishable, and it drew them in a slightly different order this time. Next month’s eval, on a fresh sample of tasks, might draw them the other way, and we’d dutifully reshuffle our mental rankings again.
None of which is an exotic statistical objection. It’s reasoning I already trusted in one place without noticing it generalised: nobody ships a change off a single A/B sample, because everyone knows one sample wobbles. A leaderboard is a wall of single samples, sorted, with the wobble cropped out of frame.
The scalar was always hiding a distribution
Even when the gap is real, ranking by one number throws away most of what you’d want to know. A composite score is an average over wildly different tasks — coding, reasoning, retrieval, refusing the wrong things — and an average is a lossy compression of the distribution underneath it. Two models with the identical headline figure can be good at almost disjoint sets of things.
That’s what people are reaching for when they say a local model isn’t a worse frontier model so much as a different one. It’s the honest reading of a benchmark: the scalar told you the area under a curve, and the shape of the curve is where the actual decision lives. Which is to say the leaderboard answers “which number is biggest” when the question you brought to it was “which of these is right for what I’m doing” — and those are not the same question, however neatly the table implies they are.
What changes when you put the bars back
I’m not arguing benchmarks are useless, and I haven’t stopped reading leaderboards — I read them most weeks. The error is in reading the rank as the whole story. A gap of fifteen points across a large eval is a signal you can act on. A gap of one point, on a few hundred tasks, is a coin landing the way it landed, and treating it as a result is how you end up migrating your whole stack on the strength of measurement noise.
What I’ve started doing about it is cheap enough to be a little embarrassing: ask for the interval before trusting the point, and when the number arrives without one, work it out. The standard error of a proportion is a one-line calculation, and it usually says the top three are a single cluster rather than a podium.
It hasn’t made me want the ranking any less. The engineer in me still reaches for the top row first, and still finds the sorted column more satisfying than a set of overlapping bars. What I’ve picked up alongside that is a second question I didn’t used to think to ask — whether the race was close enough that “won” doesn’t mean anything — and I’m still working out how often to let it overrule the first.
Part of an occasional series reframing everyday engineering through a data scientist’s eyes. The ideas here are developed properly in Thinking in Uncertainty and Building with Certainty.